Building Energy Monitoring Software – iNSIGHT EBIS

Visualise Your Building's Performance

Unify building energy and BMS data in one cloud-based platform. iNSIGHT EBIS helps facilities and energy teams monitor performance, identify inefficiencies, compare sites, and turn complex building data into actionable insight.

What is building energy monitoring software?

Building energy monitoring software gives building owners, facilities managers, and energy managers a clearer view of how a building is performing. iNSIGHT EBIS combines data from metering systems and Building Management Systems into a single source, making it easier to analyse consumption trends, correlate plant behaviour with energy use, and report on performance across one building or multiple sites.

The challenge with building and energy data

Most buildings generate large volumes of information from separate systems. Metering platforms show consumption, while BMS platforms show plant behaviour and operating conditions. When these systems are reviewed separately, analysis becomes slower, less accurate, and harder to act on.

  • Energy data and plant data often sit in different systems
  • Trend analysis can be time-consuming
  • Efficiency issues are harder to identify quickly
  • Reporting across multiple sites becomes more complex
  • Teams struggle to connect operational behaviour with energy usage

How EBIS solves this

iNSIGHT EBIS brings building energy data and BMS data together in one cloud-based platform so users can view, compare, and report on building performance more effectively. By linking consumption data with plant status, temperatures, occupancy, and other operating values, EBIS helps users spot patterns, identify anomalies, and develop better control strategies. Synapsys believes that this unified view helps managers optimise control strategies and maximise savings.

Why facilities and energy teams use EBIS

iNSIGHT EBIS is designed to help users move from raw building data to practical action. The platform supports both day-to-day monitoring and longer-term performance improvement by making information easier to view, analyse, and export.

  • See building and energy data together - View BMS points, meter data, plant status, and related values in one place.
  • Identify inefficiencies faster- Correlate energy use with plant status, temperatures, occupancy, and runtime to reveal hidden performance issues.
  • Compare sites, buildings, and time periods - Analyse daily, weekly, monthly, and date-range comparisons across areas, buildings, or estates.
  • Simplify reporting - Use dashboards, PDF reporting, and export tools to share insight with stakeholders.
  • Scale from one site to many - Monitor a single building, a campus, or a national portfolio using the same platform

Key features of iNSIGHT EBIS

EBIS combines monitoring, correlation, reporting, and analysis tools in a single cloud-based solution, featuring:

Energy Monitoring

  • Energy consumption tracking
  • Carbon footprint monitoring

Building Performance Monitoring

  • Plant runtime
  • Plant status
  • BMS data overlays

Analysis Tools

  • Cross-site comparisons
  • Date range analysis
  • Daily / weekly / monthly profiles

Reporting Tools

  • Dashboard builder
  • PDF reporting
  • CSV/XML export

How EBIS works

EBIS follows a simple monitoring workflow: collect data, unify it, analyse it, and act on it. Synapsys states that data can be imported through SIP+ or SIP2 devices or third-party data loggers, then displayed in user-defined charts and dashboards for analysis and reporting.

1. Capture data
Collect information from meters, sensors, BMS points, plant systems, occupancy sources, and other building data streams. The product sheet specifically mentions main and sub-meter data, renewables data, temperatures, humidity, CO2, occupancy, plant status, and sensors

2. Unify data
Bring independent energy and BMS datasets into one platform so they can be viewed together.

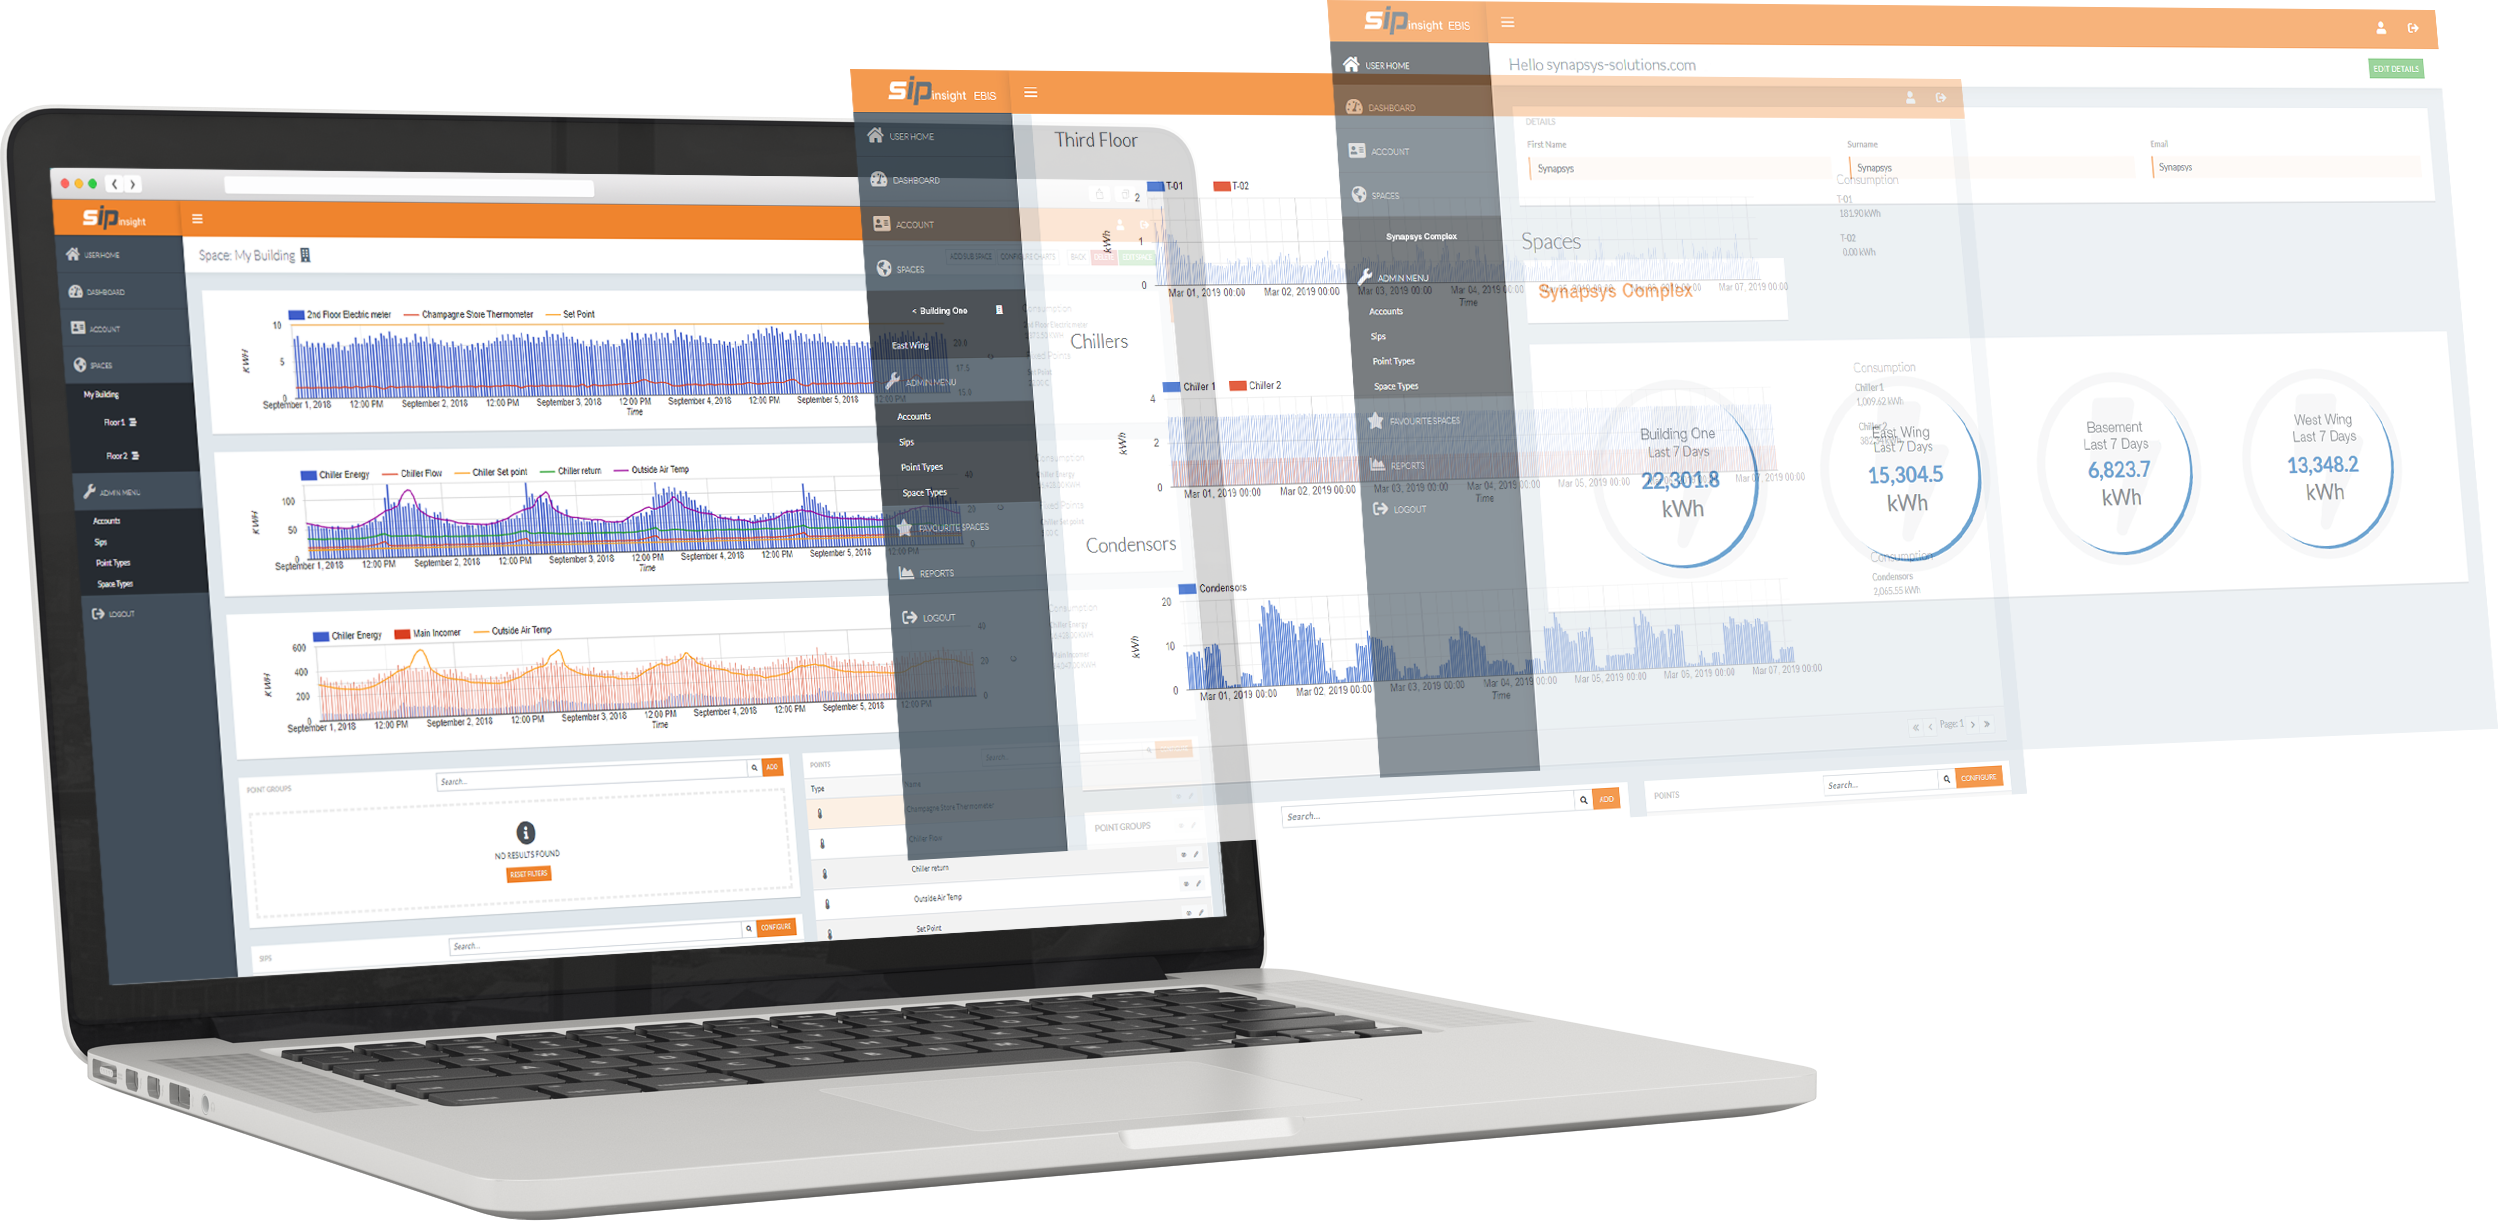
3. Analyse performance
Use dashboards, charting, profiles, and comparison tools to identify patterns, anomalies, and trends.

4. Report and improve
Export data, build reports, and use the findings to support control strategy improvements and efficiency changes.

What data can EBIS monitor?

EBIS is designed to process a wide range of building and energy data via Synapsys SIP+ and SIP2 devices as well as third-party loggers. Some data examples include:

  • Main and sub-meter data
  • Virtual meter calculations
  • Renewables data
  • BMS point values, including negative values
  • Plant status and condition
  • Plant runtime
  • Indoor and outdoor temperatures
  • Humidity, CO2, and occupancy

What can you use EBIS for?

Because EBIS combines energy and operational data, it is suited to both routine monitoring and more detailed investigation work. Uses include:

  • Compare one building against another across an estate
  • Map plant operation against energy consumption to reveal inefficiencies
  • Plot temperature values on energy graphs to understand building behaviour
  • Overlay occupancy hours to explain changes in demand or runtime
  • Build regular performance reports for internal teams and stakeholders
  • Review historical patterns over time using stored data and profile display

More than a traditional energy monitoring system

EBIS goes beyond a traditional EMS by linking energy values with BMS points and plant status, rather than only showing standalone consumption data. EBIS users can analyse not just how much energy is being used, but how building systems were operating at the same time.

See how EBIS can improve building performance

Book a personalised demonstration to see how EBIS can help your team monitor building performance, connect energy and plant data, and identify opportunities for operational improvement. We also offer Metering services and a Tenant billing service should you required support with additional systems within your buildings.

Get in touch

Book a personalised demonstration of our Building Energy Monitoring Software – iNSIGHT EBIS